Tracis is our online web portal for monitoring and analyzing data from our FieldGuard and Watchdog stations. You can access the Tracis software from any device with an internet connection (computer, smartphone or tablet) from anywhere in the world. So if your company has several production location all over the world, then you will be able to monitor all production locations from behind your computer or smartphone. This also works the other way around, so if you are a grower and you are traveling, you can still see what is going on in your company back home. The Tracis Basic Version is a powerful tool for monitoring growth conditions, but we do have some additional modules available for Frost Alerts, Smart Irrigation and Culture Tracking. Additional to these optional modules you can also integrate disease models for different types of crops. Call us on +31 543 472 334 for more information, or send us an email with your questions (info@specmeters.eu).
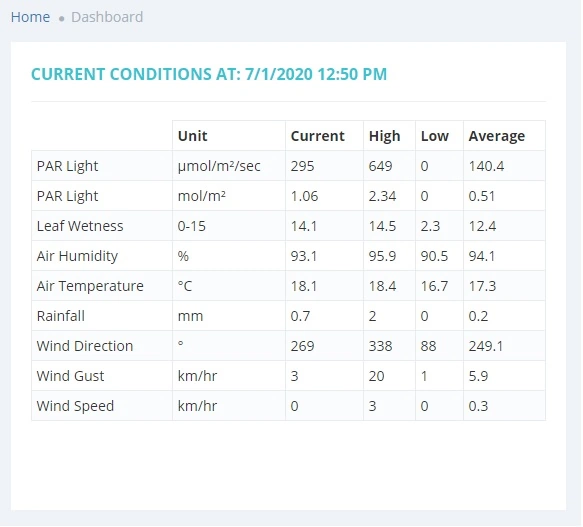
When you login to your account, then the landing page will be your dashboard. If you have more the one station in your account then you can select from the Top Menu Bar which dashboard you want to see by selecting that station. The image on the left shows the Current Conditions Window. In the Top of this Window you see when the latest update was received (CURRENCT CONDITIONS AT: 7/1/2020 12:50PM)
Below this you see a list of all the sensors that are connected to this particular station, and the units in which data is presented. In the
we have highlighted Air Temperature, and you can that this data is presented in degrees Celsius, The last measurement was 18.1 °C, and that
the highest temperature for today was 18.°C. Furthermore you can also see what today's lowest temperature was and the average temperature.
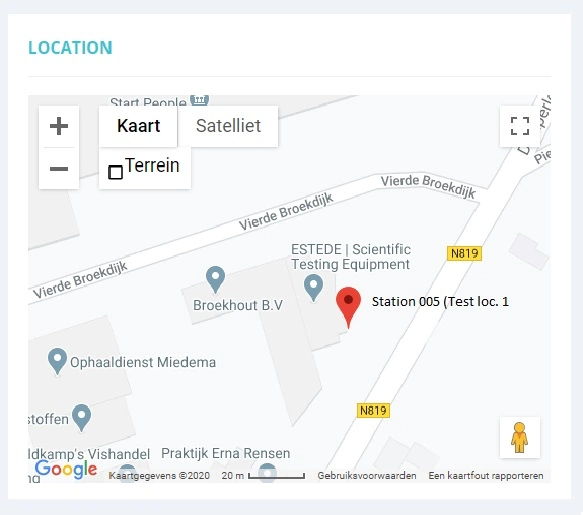
Especially when you have more than one station it is helpful to know where this station is located. So for each station in your account
you can enter the coordinates with the exact position and elevation of this station. Because we use google maps for this feature you can also
switch between Maps View and Satellite View, Zoom IN Zoom Out or look at this location from Street View.
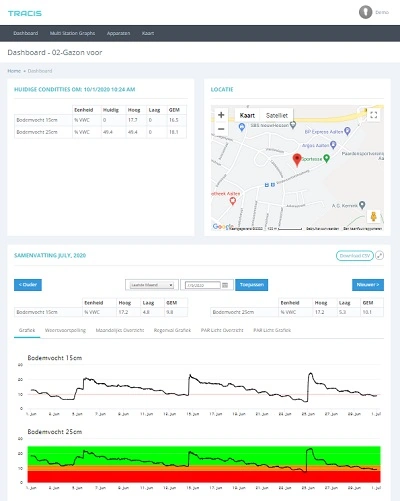
Summery and graphs is use to present the actual data from a station over time in a line graph or Columns (depending on the parameter). In the left
you can a graph showing Soil Moisture at 2 different depths (15cm and 25cm). By using budget lines we can show whether Soil Moisture is within a
good range, or when it becomes to dry (for more information on budget lines see EQUIPMENT). You can change to periode you want to monitor from 1 day,
to last 7 days or to month and with the buttons OLDER and NEWER you can go back and forward through the season. On the Top right in this window you
find a DOWNLOAD CSV button in case you want to download data from this station.
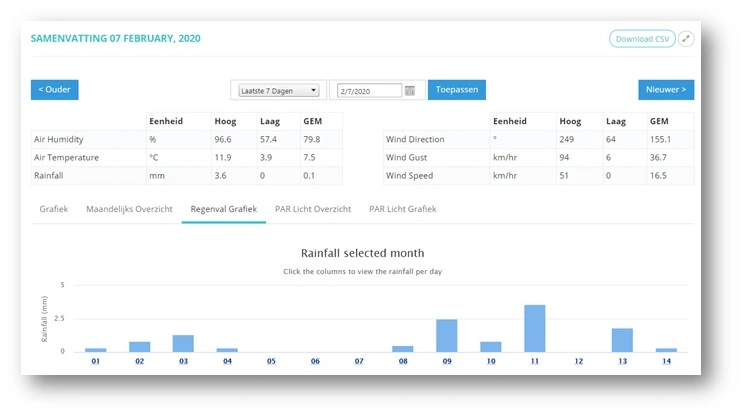
The amount of Soil Moisture Available in the soil depends largely on the amount of precipitation. So if we know exactly how much Rain has fallen over
a particular period in time we also know what influence this amount of rain has had on the available Moisture in the soil. Based on this information
we can also decide when to irrigate and how much. In combination with our Tracis Smart Irrigation System (optional module) precipitation data is an
important parameter for autonomous Irrigation. The Graph on the left shows the amount of rain over a month, by clicking on a particular day you see
the distribution of rainfall during that day.
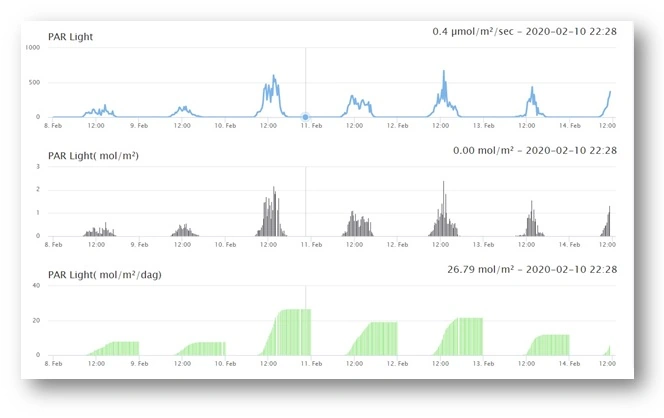
FieldGuard and Watchdog stations can measure PAR light, UV-ligth and / or Solar Radiation (depending on the sensors connected). When we measure PAR light, then it is also posible to calculate the Daily light integral, referred to as DLI, DLI is the amount of photosynthetically active radiation (PAR) received each day as a function of light intensity and duration. It is expressed in terms of moles of light per square meter per day, or mol·m-2·d-1. This metric is important to measure since the amount of light your plants get in a day relates directly to plant growth, development, yield, and crop quality. Latitude, time of year, and length of day will all affect your DLI. Throughout the year, outdoor DLI ranges from 5 to 60 mol·m-2·d-1, however, in the greenhouse, values seldom exceed 25 mol·m-2·d-